Executive MBA Class Profile
EMBA Class of 2027 by the Numbers
EMBA Class of 2027 Profile – Text Version
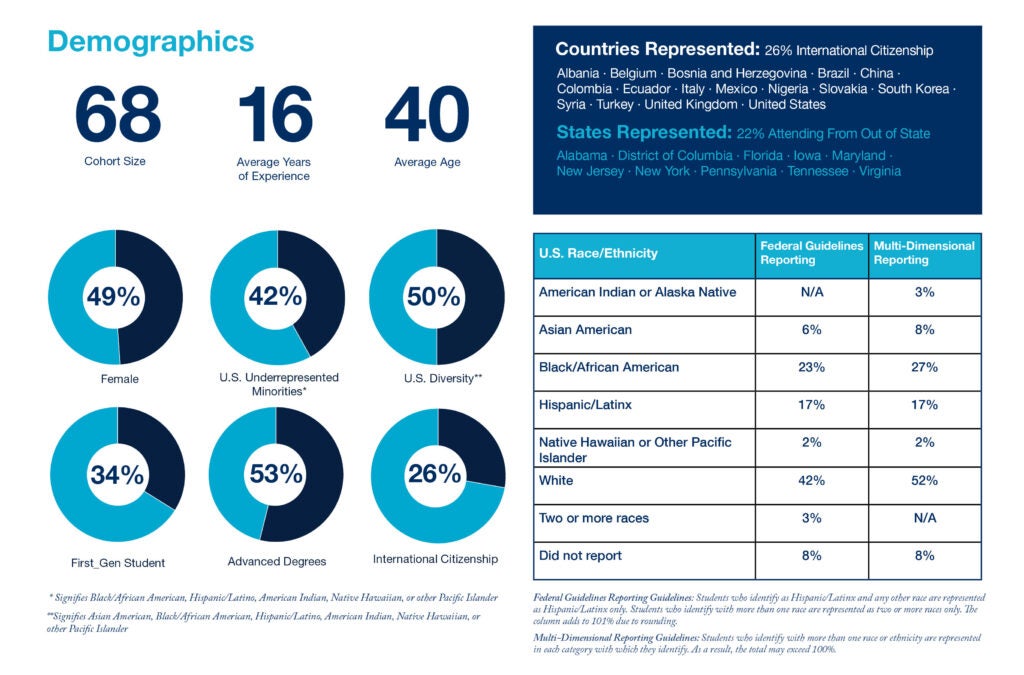
Demographics
Class Size: 68, Average Years of Experience: 16, Average Age: 40, 49% Female, 42% U.S. Underrepresented Minorities*, 50% U.S. Diversity**, 53% Advanced Degrees, 63% International Experience
*Signifies Black/African American, Hispanic/Latino, American Indian, Native Hawaiian, or other Pacific Islander
**Signifies Asian American, Black/African American, Hispanic/Latino, American Indian, Native Hawaiian, or other Pacific Islander
Countries Represented
Albania, Belgium, Bosnia and Herzegovina, Brazil, China, Colombia, Ecuador, Germany, Israel, Italy, Mexico, Nigeria, Slovakia, South Korea, Syria, Turkey, United Kingdom, United States
States Represented
Alabama, District of Columbia, Florida, Iowa, Maryland, New Jersey, New York, Pennsylvania, Tennessee, Virginia
U.S. Race/Ethnicity, Federal Guidelines Reporting
American Indian or Alaska Native: 0%, Asian American: 6%, Black/African American: 23%, Hispanic/Latino: 17%, Native Hawaiian or Other Pacific Islander: 2%, White: 42%, Two or more races: 3%, Did not report: 8%
Federal Guidelines Reporting Guidelines
Students who identify as Hispanic/Latino and any other race are represented as Hispanic/Latino only. Students who identify with more than one race are represented as two or more races only. The column adds to 99% due to rounding.
U.S. Race/Ethnicity, Multi-Dimensional Reporting
American Indian or Alaska Native: 3%, Asian American: 8%, Black/African American: 27%, Hispanic/Latino: 17%, Native Hawaiian or Other Pacific Islander: 2%, White: 52%, Two or more races: N/A, Did not report: 8%
Multi-Dimensional Reporting Guidelines:
Students who identify with more than one race or ethnicity are represented in each category with which they identify. As a result, the total may exceed 100%.
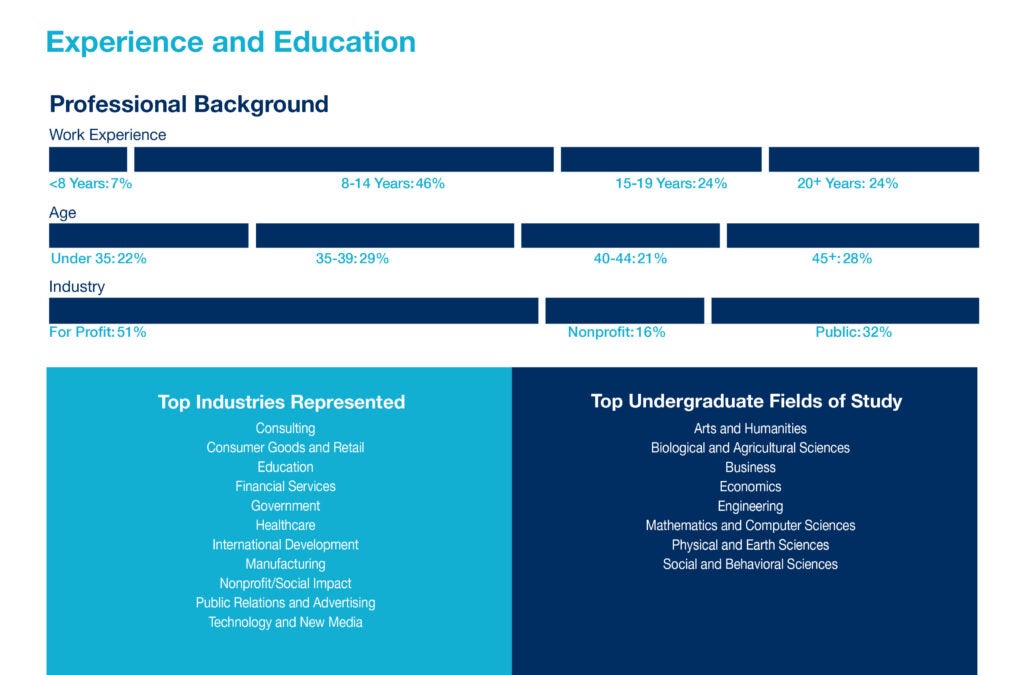
Experience and Education
Work Experience <8 Years: 7%, 8-14 Years: 46%, 15-19 Years: 24%, 20+ Years: 24%, Age Under 35: 22%, 35-39: 29%, 40-44: 21%, 45+: 28%
Industry
For-Profit: 51%, Nonprofit: 16%, Public: 32%, Top Industries Represented: Consulting, Consumer Goods and Retail, Education, Financial Services, Government, Healthcare, International Development, Manufacturing, Nonprofit/Social Impact, Public Relations and Advertising, Technology and New Media
Undergraduate Fields of Study
Business: 25%, Social and Behavioral Sciences: 24%, Biological and Agricultural Sciences: 9%, Economics: 7%, Mathematics and Computer Sciences: 9%, Engineering: 6%, Arts and Humanities: 7%, Physical and Earth Sciences: 1%, Other Fields: 12%


Questions? Contact our EMBA Program Admissions Team
We can answer questions about making an investment in your future through the Executive MBA program
emba@georgetown.edu / +1 (202) 687-8863 / Frequently Asked Questions