
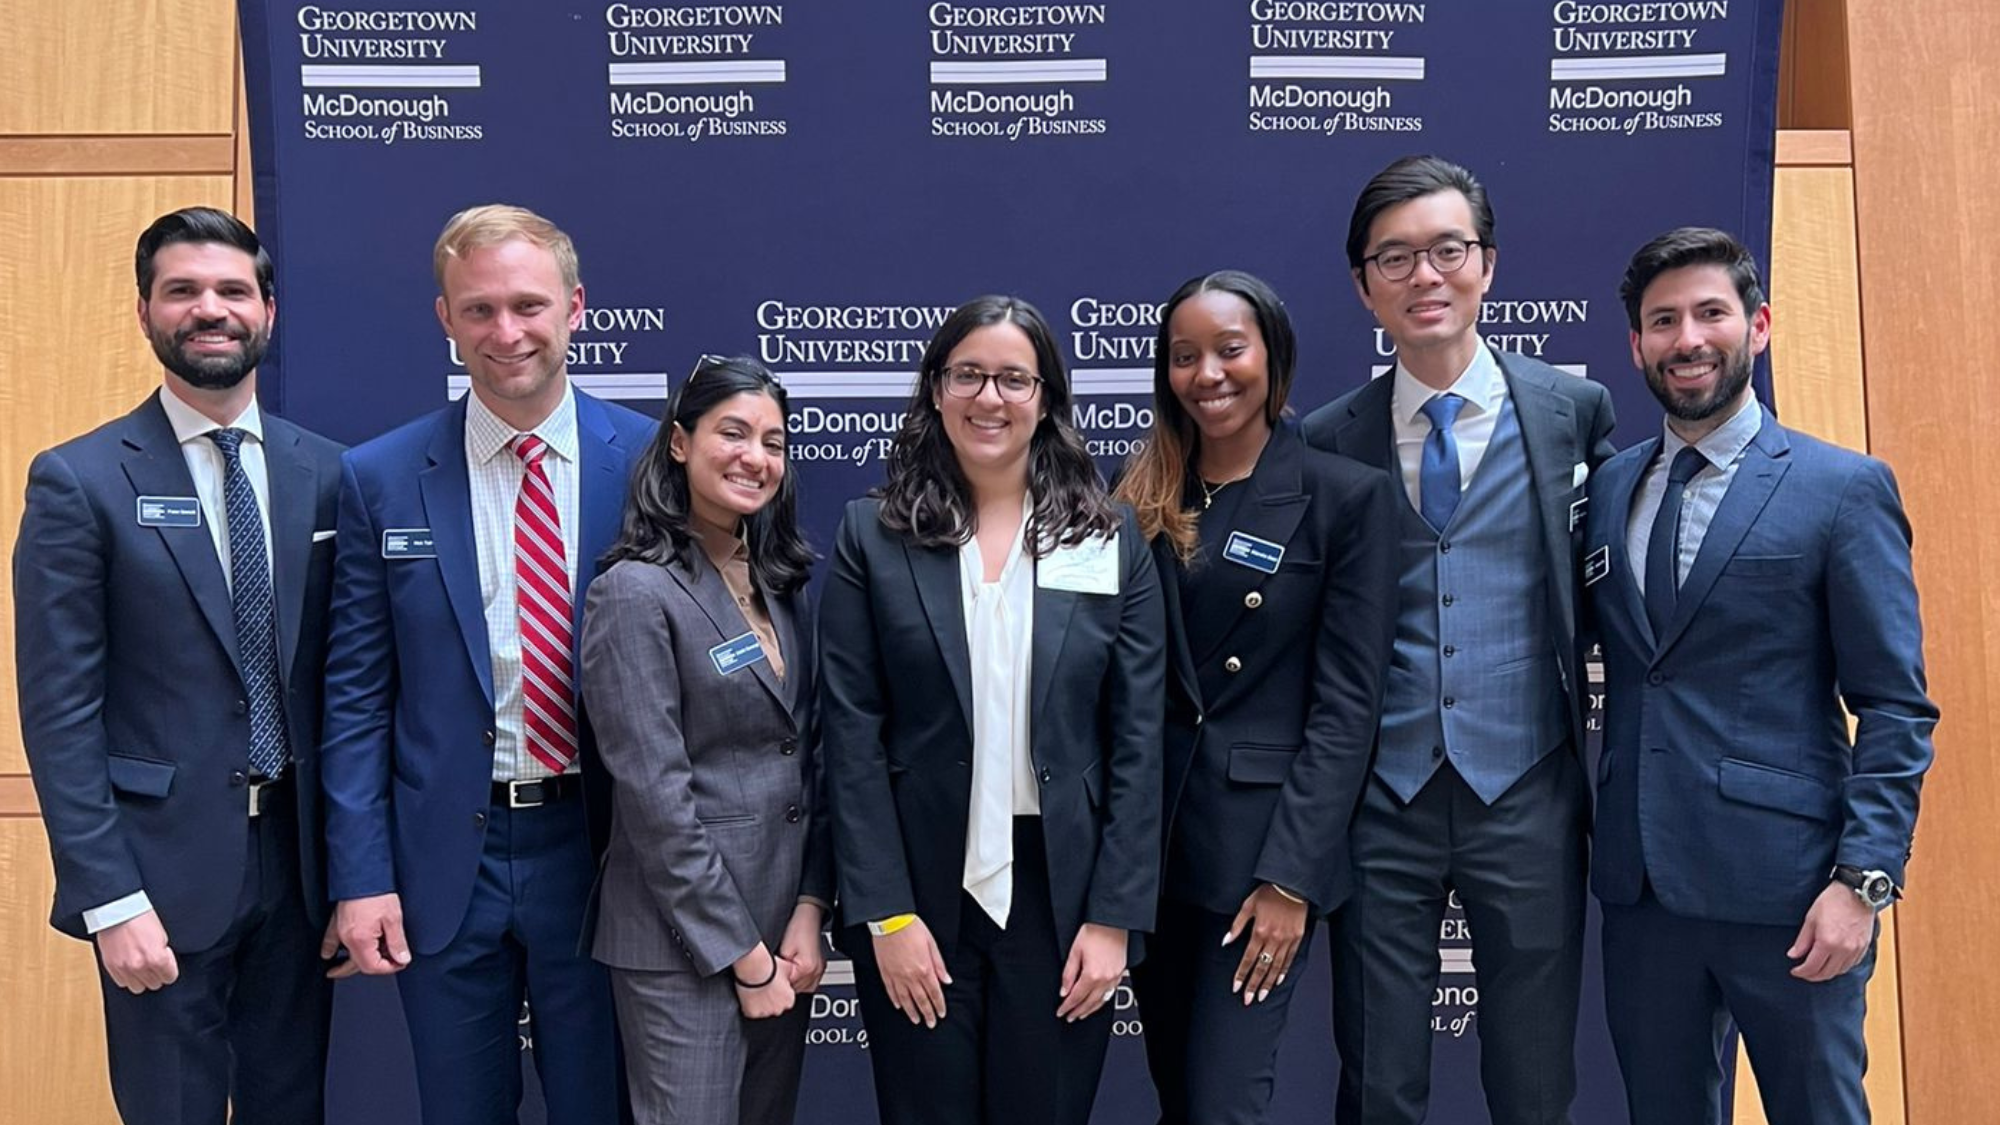
Building a Community in Diversity at McDonough
Georgetown’s McDonough School of Business is committed to fostering a community in diversity, one of many Jesuit values embedded in Georgetown’s centuries-old tradition of serving the common good.
At McDonough, we are committed to understanding the diverse perspectives and experiences of our faculty, staff, students, and alumni; transparency in our work; and thoughtfully enacting meaningful change within our community and throughout the world.
Students
Georgetown McDonough prioritizes an inclusive student community. Explore resources fostering diverse perspectives, meaningful conversations, and active contributions to a campus culture that celebrates differences.
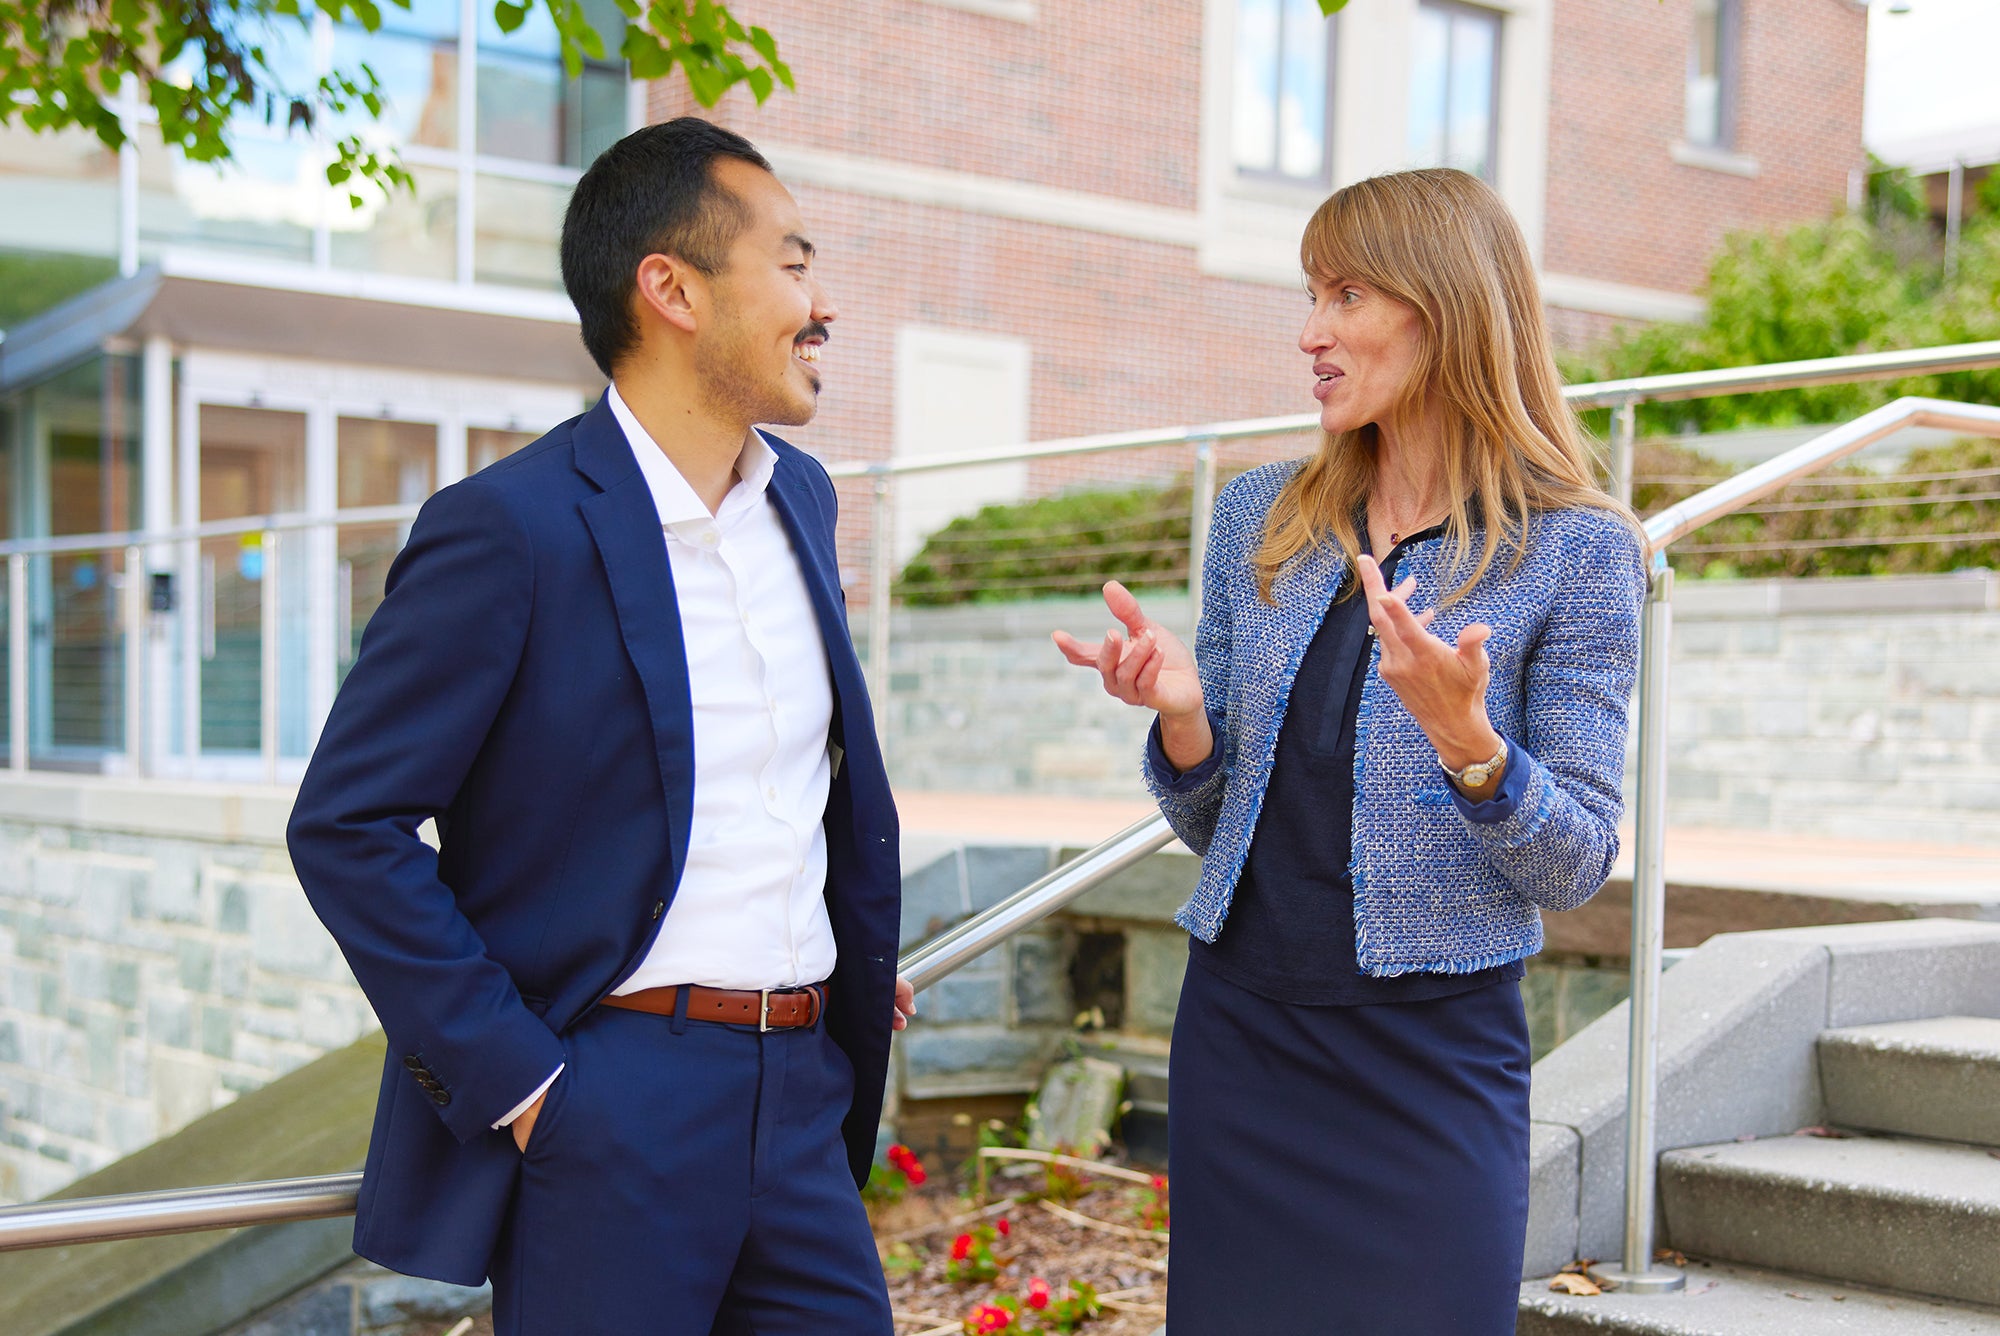
Faculty & Staff
We seek to empower faculty and staff with resources dedicated to fostering our sense of community in diversity. Our university provides tools and training to cultivate an inclusive environment, ensuring that every member contributes to a campus culture that values and respects diverse perspectives.
Ongoing Initiatives
Georgetown McDonough facilitates a number of initiatives aimed at fostering a community in diversity within the school, across the university, and in the greater D.C. region.
“It’s my hope and belief that our students, faculty, staff, and alumni will lead the way in creating a fairer world. Our community will be women and men for others. We will be allies to one another. We will set an example. We won’t tolerate intolerance. We will speak up against injustice. We will be the best in the world and the best for the world.”
Paul Almeida, Dean and William R. Berkley Chair
Diversity by the Numbers
*U.S. Diversity signifies African American, Asian American, Hispanic American, and Native American

Leading a Community in Diversity
Georgetown McDonough’s strategy is guided by faculty, staff, and student leadership committees aimed at being responsive to the evolving needs of our community.
Leadership and CommitteesMcDonough Diversity in Community News
All McDonough Diversity in Community News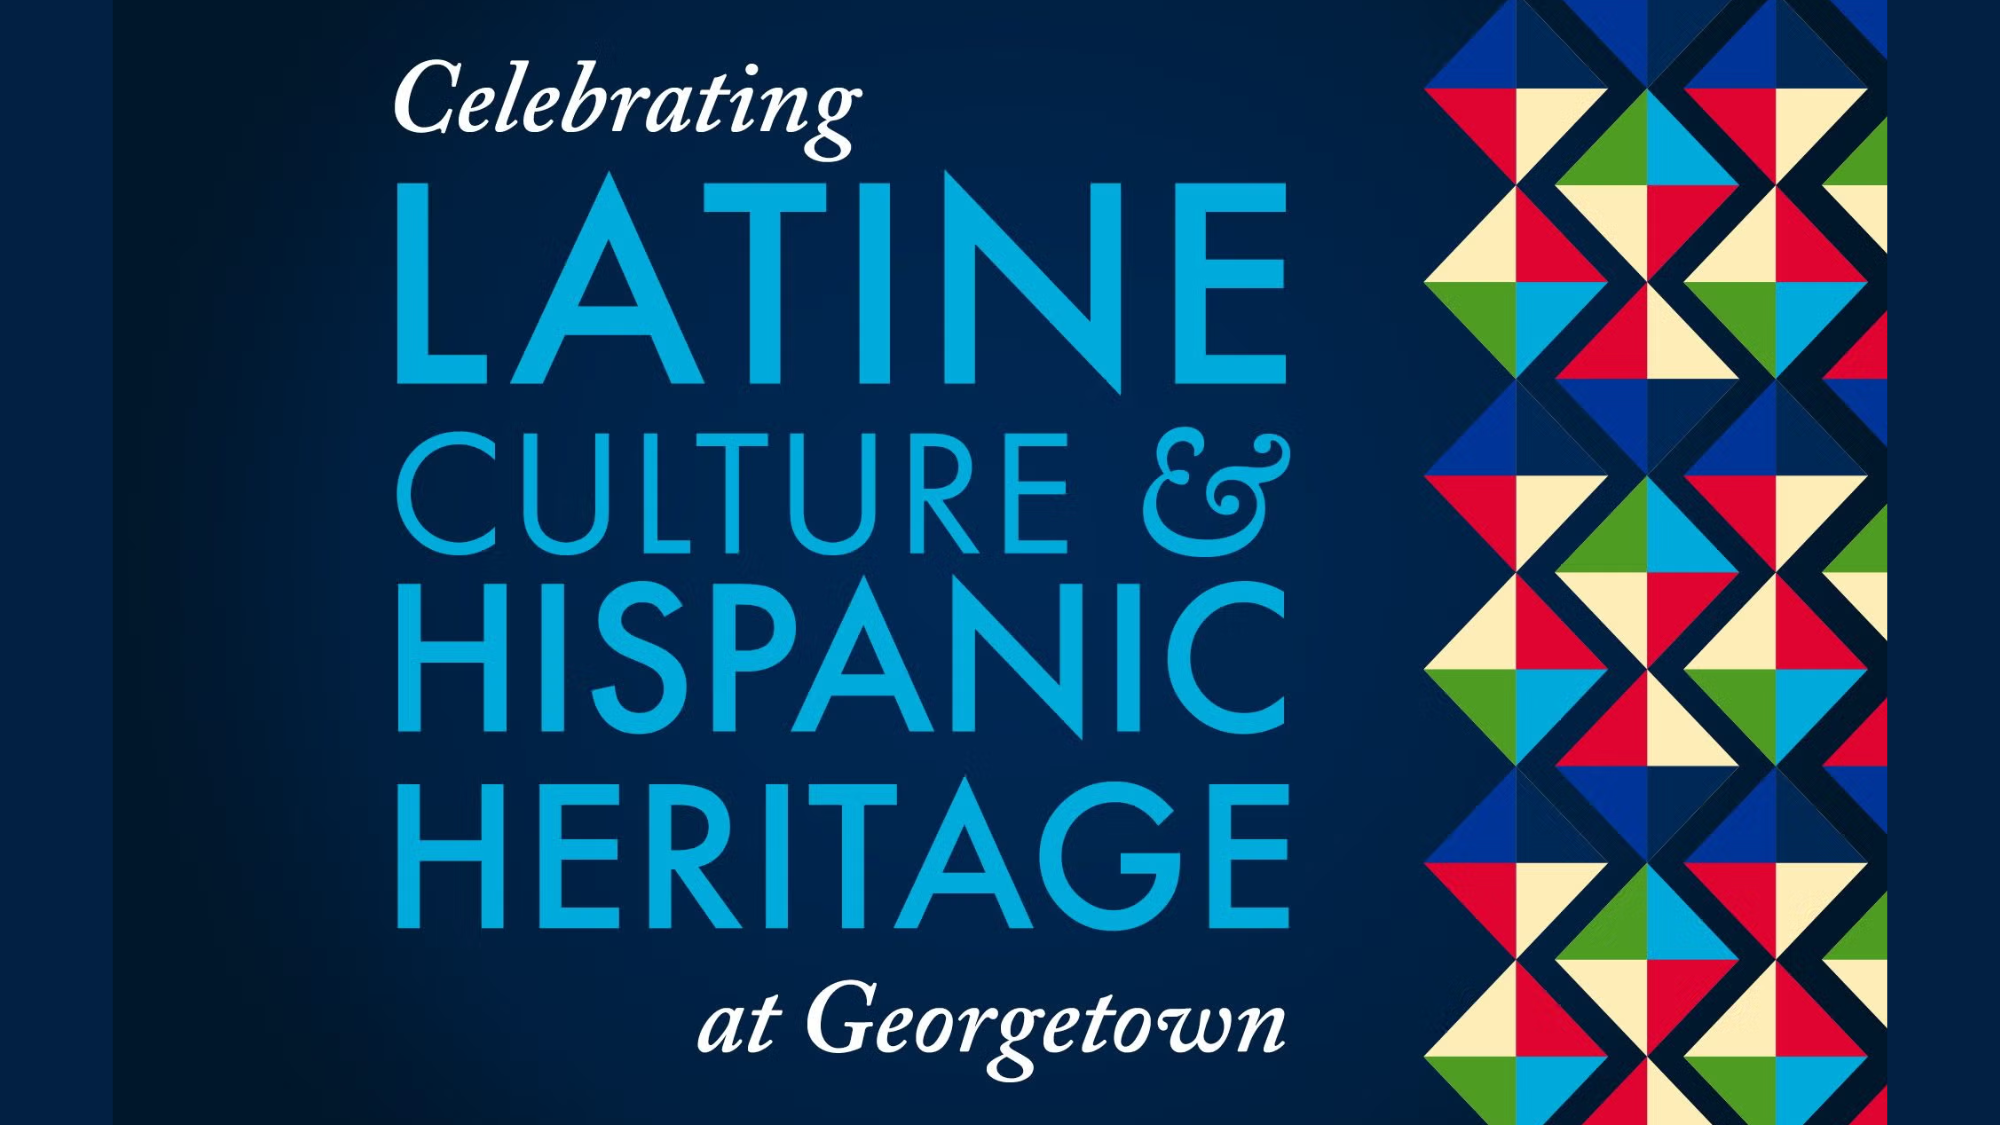
Student Experience
Celebrating Latine Culture and Hispanic Heritage at Georgetown
Georgetown community members connect with Latine culture and Hispanic heritage through teaching, research and scholarship and by building community around shared identity and experiences. We honor the vibrant histories, languages, traditions and values that transcend borders and unite Latine people across the Americas and Caribbean islands.
September 15, 2025
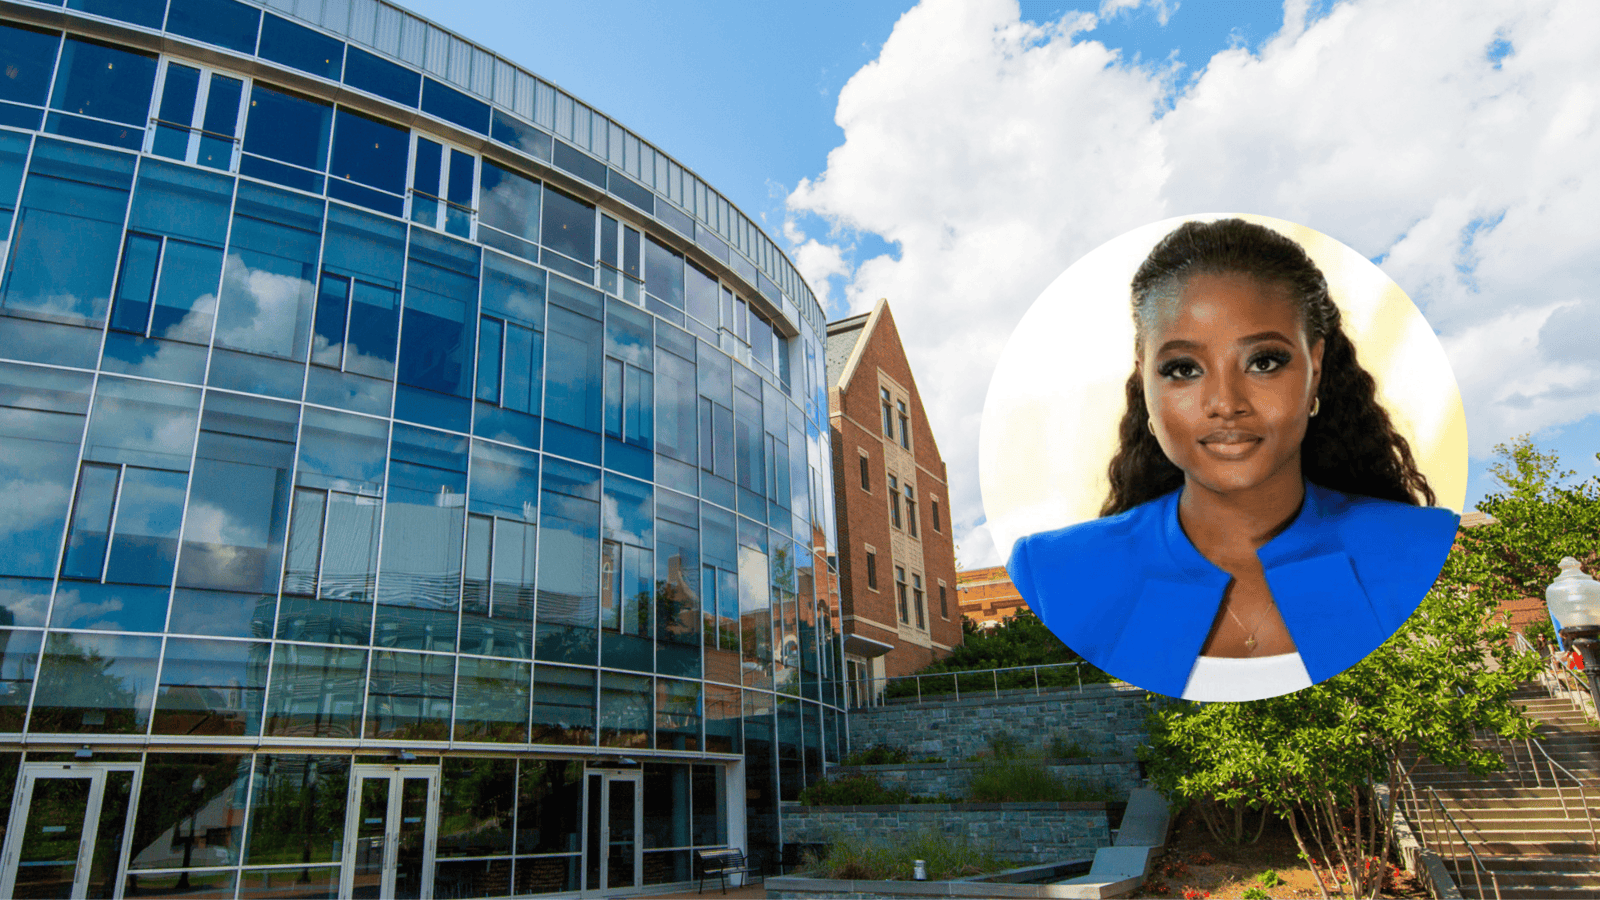
Admissions
Moksy Dosunmu (MBA’26) aspires to be a leader in finance and an advocate for women in business, which the John F. Dealy Scholarship through the Georgetown McDonough MBA program is helping her achieve.
March 11, 2025
Jesuit Values
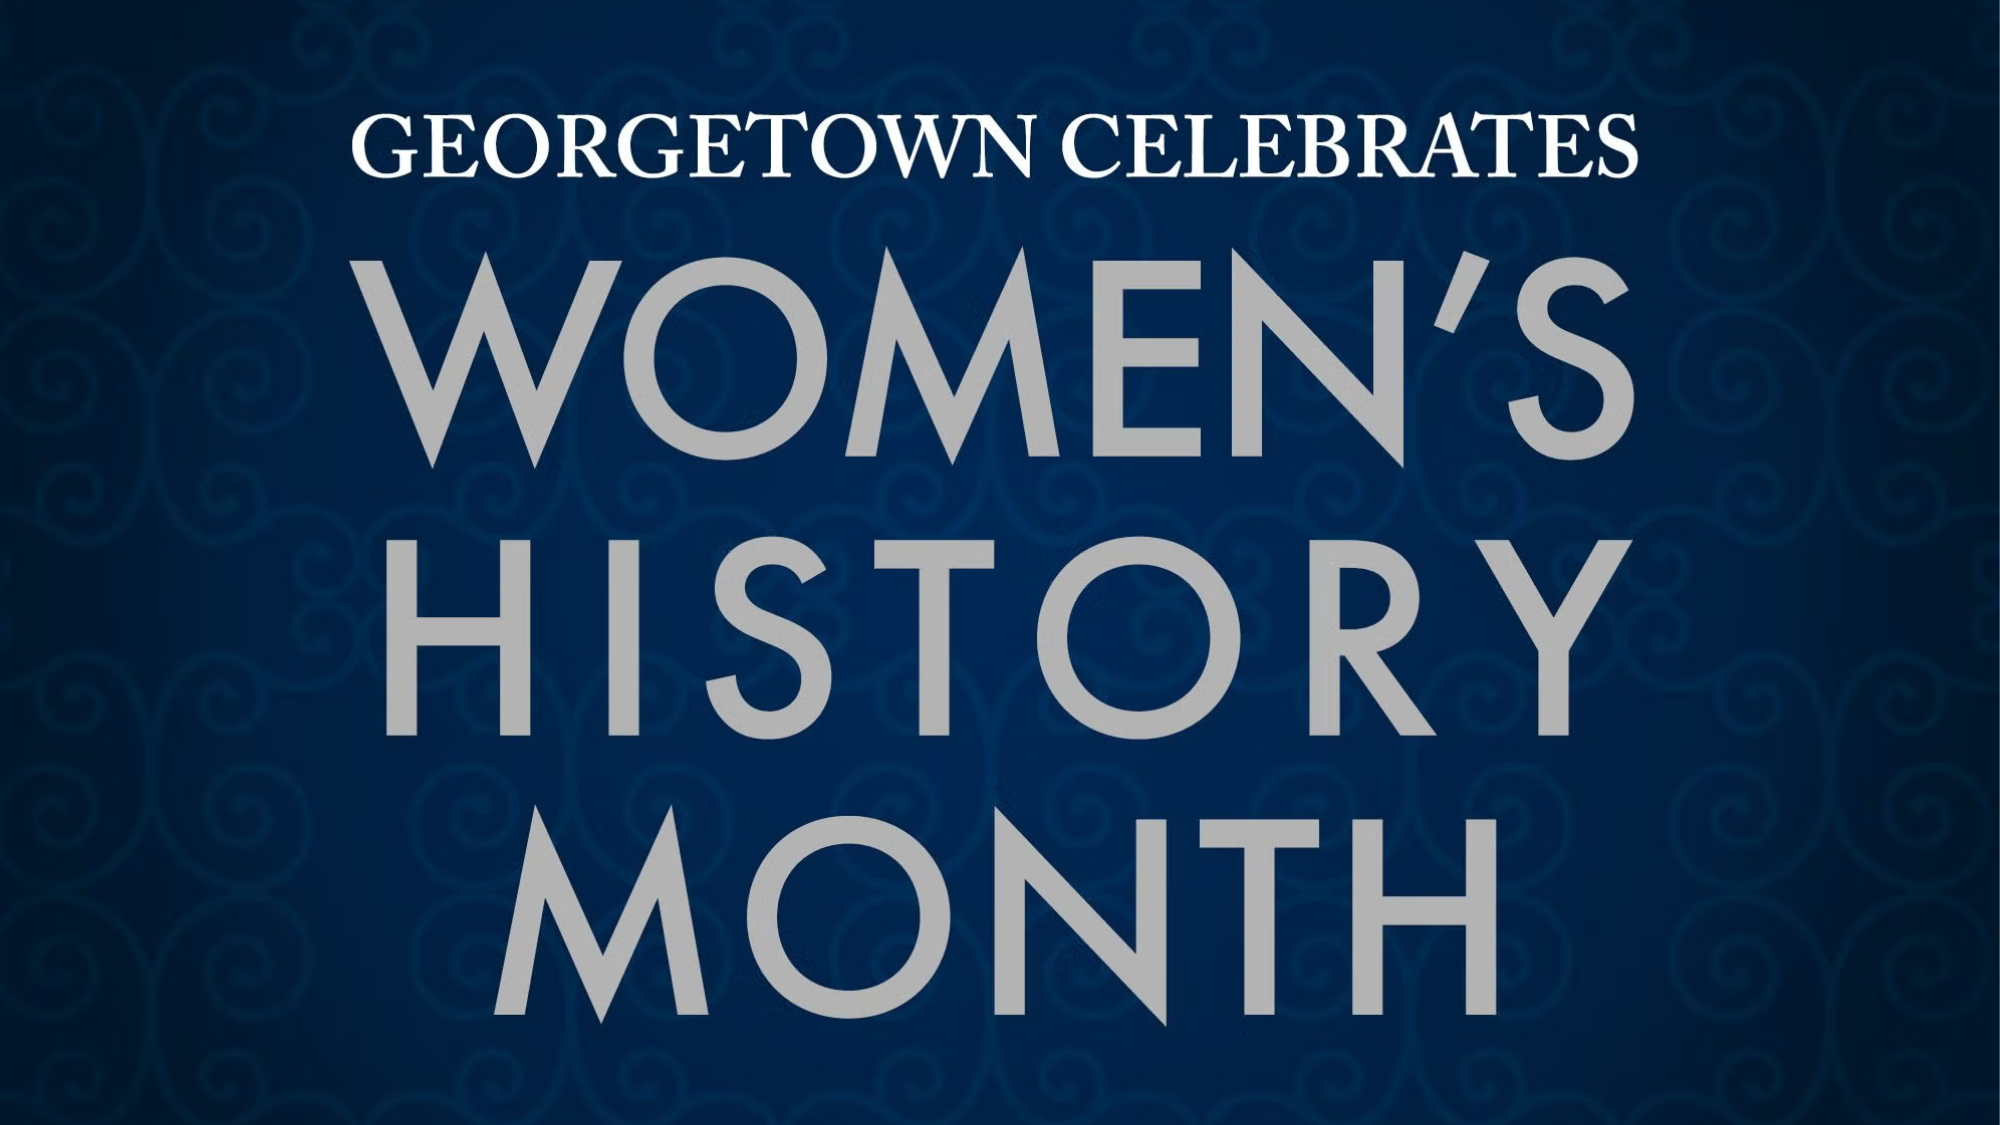
Celebrating Women’s History at Georgetown
We celebrate the many contributions of our women students, faculty and staff to our university community and society at large, and recognize the broad range of teaching, scholarship and advocacy at Georgetown that advance women’s history and equality.
March 4, 2025